1 Gridded Population Estimates
WorldPop produces population estimates for every 100 x 100 meter grid square with national coverage for countries throughout the world. Gridded data allow end-users to aggregate grid cells to estimate the total population within any boundaries that meet their needs. It also provides a consistent grid to facilitate combining data sets like population, age-sex structure, vaccinations, maternal health, poverty, etc.
There are three broad categories of methods that WorldPop uses to produce gridded population estimates:
- Top-down
- Bottom-up
- Peanut butter
These approaches require different inputs (i.e. population data) and the gridded population estimates that they produce have different characteristics (Fig. 1.1). Top-down methods require data from a complete recent census or other admin totals for each administrative unit (or other geographic unit). Bottom-up methods require data from geolocated household surveys that contain a representative sample of locations across the country. For top-down approaches, the population totals for administrative units are pre-defined by the input data, whereas in bottom-up approaches, the population totals are an emergent property that is not pre-defined.
The peanut butter method is different because it relies solely on expert opinion (rather than hard data) to define the average number of people per building. The effectiveness of this method relies on the quality of the high resolution building footprints that are used (Ecopia.AI & Maxar Technologies, Inc. 2019-2021). This approach may be a good option when recent and reliable data from a national census and/or household surveys are not available.
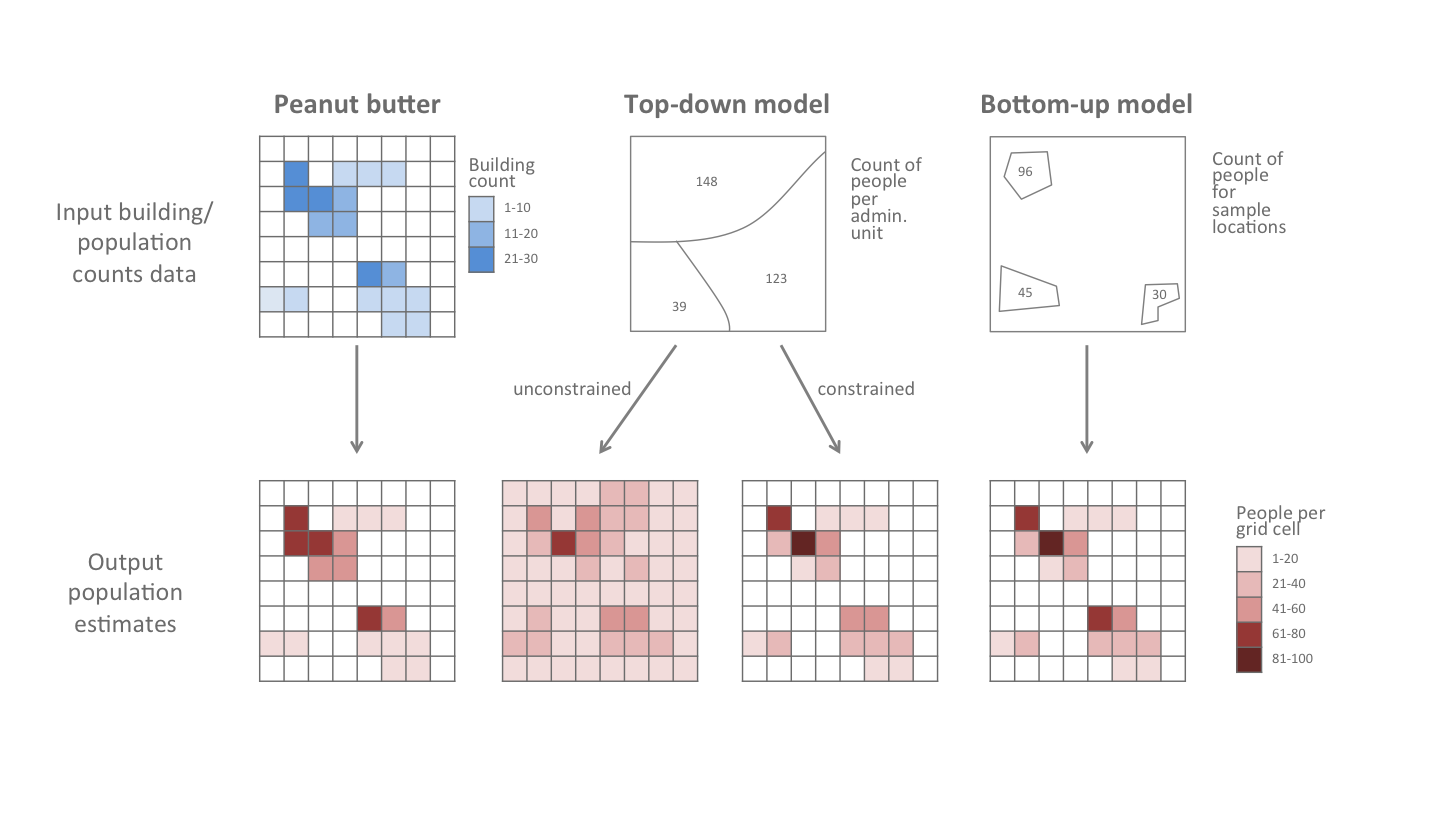
Figure 1.1: Comparison of inputs and outputs for four types of gridded population estimates (from bottom-left to bottom-right): peanut butter, top-down, top-down constrained, and bottom-up.
1.1 Top-down
The top-down method (Stevens et al. 2015a) disaggregates known population totals for each administrative unit (e.g. states or local government areas) into 100 m gridded population estimates (Fig. 1.1). Population totals may be obtained from national census results projected to the current year (or other years). Gridded population estimates are created by using machine learning methods (random forest models) to disaggregate population totals based on relationships with spatial covariates such as building density, distance to city centre, or intensity of nighttime lights. The disaggregation can be applied across the entire country or constrained only to areas where settlements have been mapped.
This is a good approach when recent census totals are available. These models perform best when accurate census totals are available for the smallest administrative units. When census results are outdated, this method relies on projections that can introduce error. Top-down methods generally do not produce estimates of uncertainty.
See the Top-down Models section for details.
1.2 Bottom-up
The bottom-up method (Wardrop et al. 2018a, Leasure et al. 2020d) takes geolocated household survey data from a sample of locations and fits it to a statistical model to estimate population sizes for unsampled areas based on relationships with spatial covariates (Fig. 1.1). This approach applies customized statistical models to make the best use of available survey data and to provide probabilistic estimates of uncertainty.
This is a good approach where recent geolocated household survey data is available or where there has not been a recent or complete national census. This approach provides robust estimates of uncertainty but requires more detailed input data and more time to develop the models.
See the Bottom-up Models section for more details.
1.3 Peanut Butter
The peanut butter method takes user-provided estimates of people per building and “spreads” them evenly (like peanut butter) amongst buildings. This is a quick and simple approach that utilizes high resolution maps of building footprints, assuming that the same number of people live in each building across entire regions or settlement types (e.g. urban and rural). WorldPop partners with Maxar Technologies, Ecopia.AI, and the Bill and Melinda Gates Foundation for recent maps of buildings (Ecopia.AI & Maxar Technologies, Inc. 2019-2021, Dooley et al. 2020a).
This is a good approach when rapid-response population estimates are needed and there is no available data suitable for more data-driven methods. The peanut butter method ignores spatial variation of people per building within each region or settlement type and there is often no objective basis for assessing uncertainty.
The peanut butter method can be applied in aggregation mode or disaggregation mode:
Aggregation mode relies on expert opinion to define the average number of people per building footprint in each region or settlement type.
Disaggregation mode calculates the average number of people per building footprint based on user-provided population totals in each region.
In both cases, the user-provided estimates of people per building are mapped to every building footprint. Population totals within each 100 m grid cell or administrative unit are calculated by summing across all of the relevant building footprints.
Try the peanut butter method yourself using the peanutButter web application or the peanutButter R package (Leasure et al. 2020c).
1.4 Comparison of Data
Within these three broad categories, WorldPop develops a variety of methods for producing gridded population estimates with different characteristics. Selecting the right population estimation method depends on project requirements (e.g. time and resource availability) and data availability. Table 1.1 below provides a summary of the characteristics for the different methods of WorldPop gridded population estimates.
| Peanut Butter | Census Projections | UN-adjusted | Constrained | Custom | Bottom-up Bayesian | |
|---|---|---|---|---|---|---|
| Input Population Data | ||||||
| Expert opinion (e.g. people per building) | X | |||||
| Population totals for admin units | X | X | X | X | ||
| Geolocated household survey data | X | |||||
| Output Data | ||||||
| Gridded population estimates (~100 m) | X | X | X | X | X | X |
| Sum to match projected census totals | ? | X | X | ? | ||
| Adjusted to match UN admin unit totals | ? | X | ? | |||
| Constrained to buildings | X | X | X | X | ||
| Include estimates of uncertainty | X | |||||
| Access | ||||||
| www.worldpop.org | X | X | X | |||
| ftp.worldpop.org | X | X | X | X | X | |
| wopr.worldpop.org | X | X | ||||
| apps.worldpop.org/woprVision | X | X | ||||
| apps.worldpop.org/peanutButter | X | |||||
With any of these methods, gridded estimates of total population can be divided into specific age-sex groups using WorldPop’s pre-existing gridded age-sex proportions. With bottom-up methods, it is also possible to estimate age-sex proportions directly from household survey data when it is available.
Contribution
This chapter was written by Douglas Leasure and Claire Dooley