class: center, middle, inverse, title-slide # Statistical population modelling for census support ## Conclusive remarks ### Edith Darin --- # Introduction --- class: inverse, left, middle # What have we learned so far? --- class: center, middle # Bayesian philosophy -- #### A story -- The prior -- #### Observed data -- The likelihood -- #### Updated information -- The posterior --- # Example *Suppose you have a globe representing the planet that you can hold in the hand* .pull-left[ Question: how much of the surface is covered by water? Experiment: 1. Toss the globe in the air 2. Catch it back 3. Record the nature of the surface under your right finger Scenario example: WLWWLWWWLWLL ] .pull-right[  ] .footnote[*Statistical Rethinking, A Bayesian Course with Examples in R and Stan* by Richard McElreath] --- # Example .center[<img src="day5_presentation_files/pic/day5_water.PNG" alt="drawing" width="350"/> ] .footnote[*Statistical Rethinking, A Bayesian Course with Examples in R and Stan* by Richard McElreath] --- class: center, middle # MCMC estimation process -- ### Chains -- ### Initialisation -- ### Warmup -- ### Iterations --- class: center, middle # Population model --- ### Population counts are discrete, positive <br> .pull-left[ 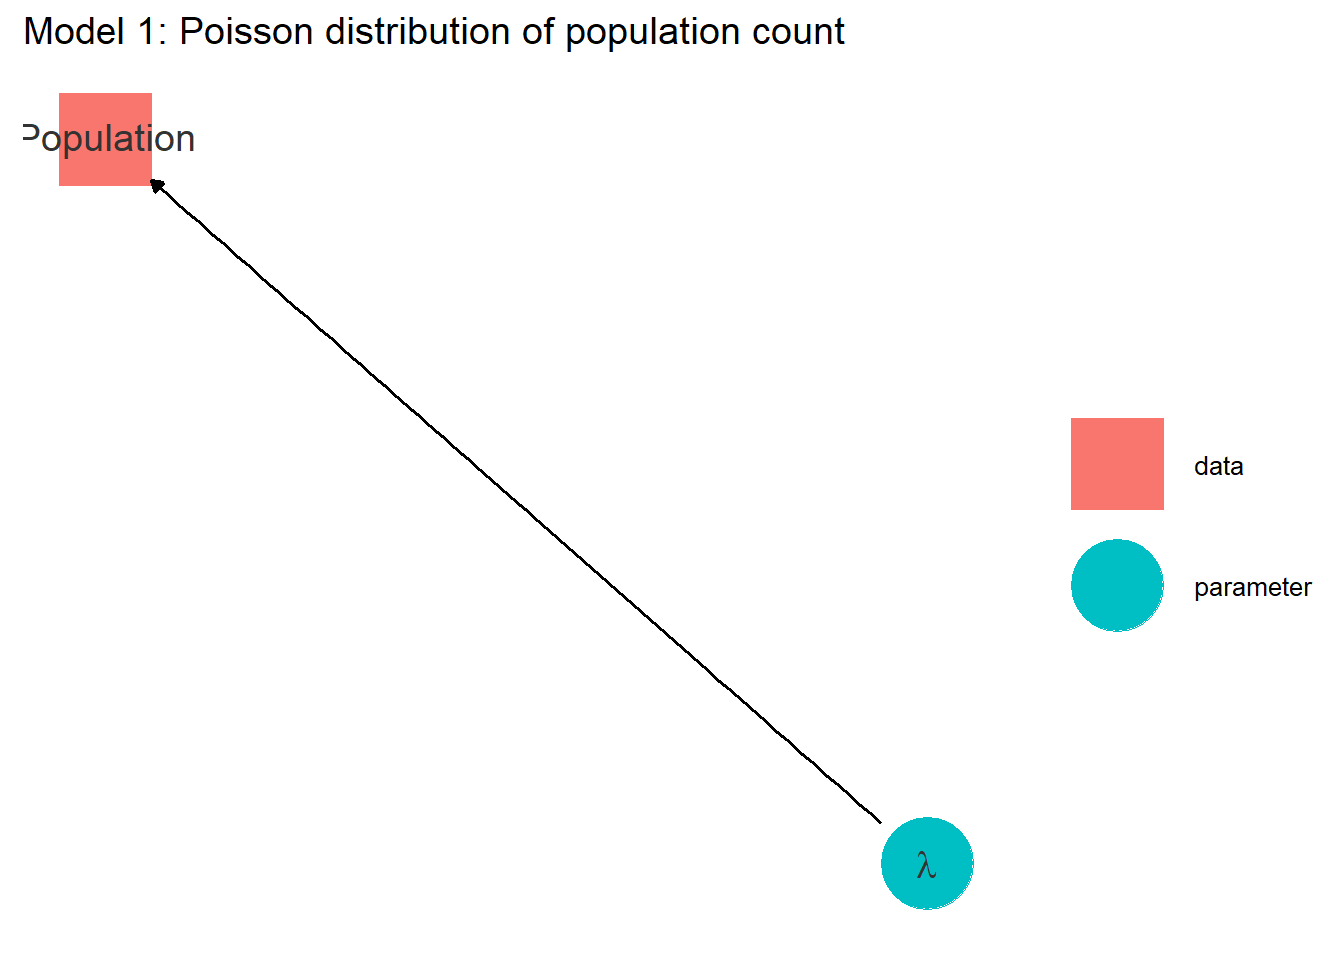 ] .pull-right[ `$$population \sim Poisson( \lambda )$$` ] --- ### Population counts have overdispersion <br> .pull-left[ 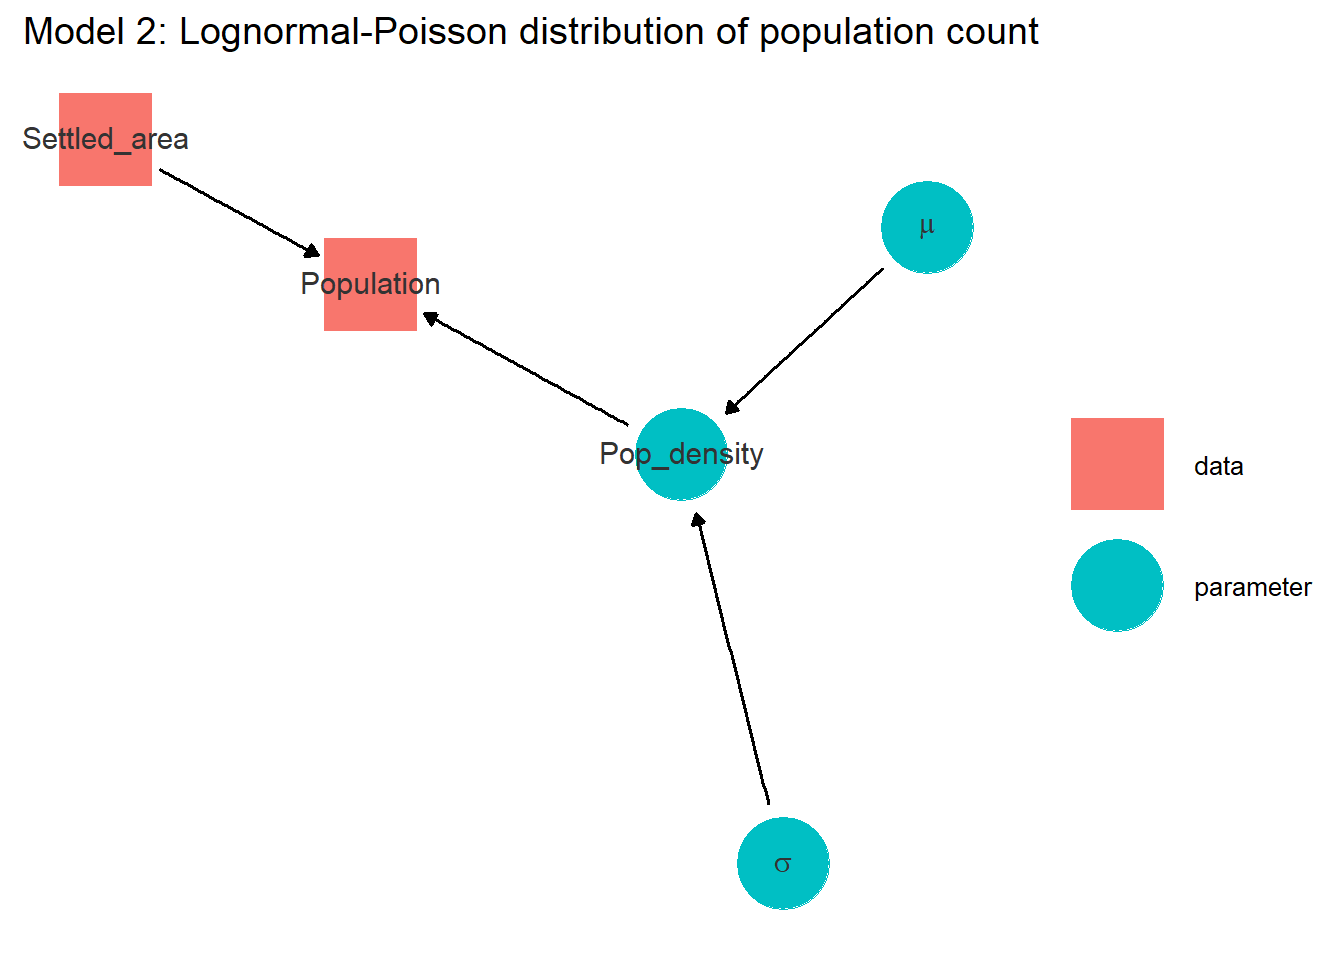 ] .pull-right[ `$$pop \sim Poisson( pop\_density * settled) \\$$` `$$pop\_density \sim Lognormal( \mu, \sigma)$$` ] --- ### Population counts varie by region and type <br> .pull-left[ 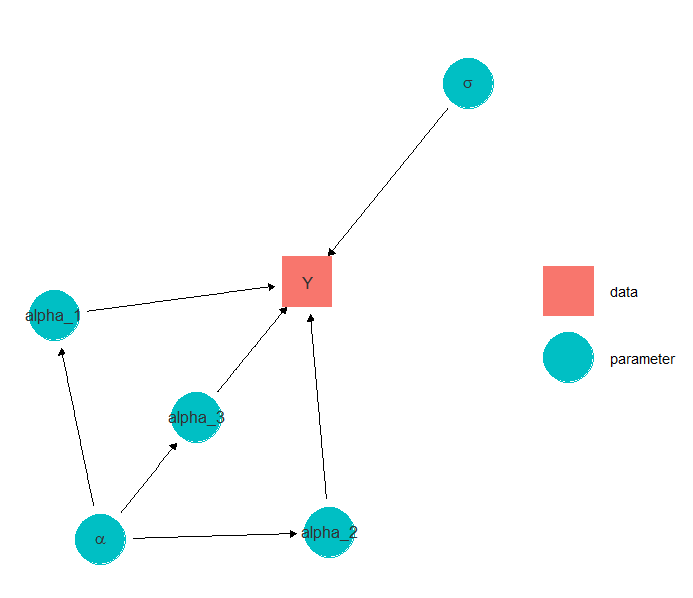 ] .pull-right[ `$$pop \sim Poisson( pop\_density * settled)$$` `$$pop\_density \sim Lognormal( \alpha_{t,r}, \sigma)$$` <br> $$\alpha_{t,r} \sim Normal(\alpha_t, \nu_t) $$ <br> `$$\alpha_t \sim Normal( \alpha, \nu) \\$$` ] --- ### Population counts varie locally <br> .pull-left[ 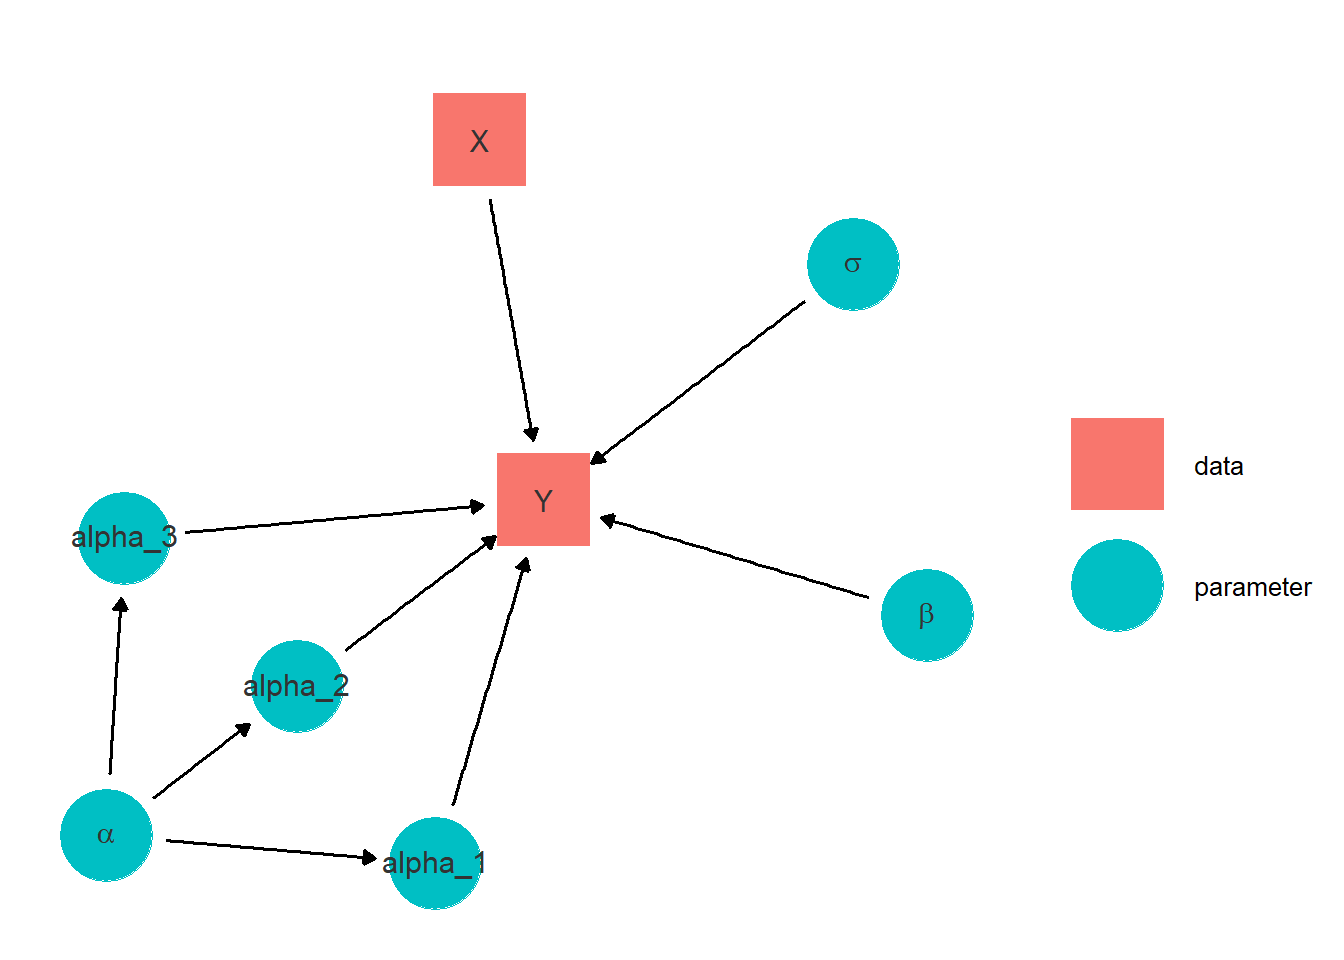 ] .pull-right[ `$$pop \sim Poisson( pop\_density * settled)$$` `$$pop\_density \sim Lognormal( \mu, \sigma)$$` <br> `$$\mu = \alpha_{t,r} + \beta X \\[10pt]$$` <br> `$$\alpha_{t,r} \sim Normal(\alpha_t, \nu_t)$$` <br> `$$\alpha_t \sim Normal( \alpha, \nu)$$` ] --- ### Local variations varie by settlement type <br> .pull-left[ 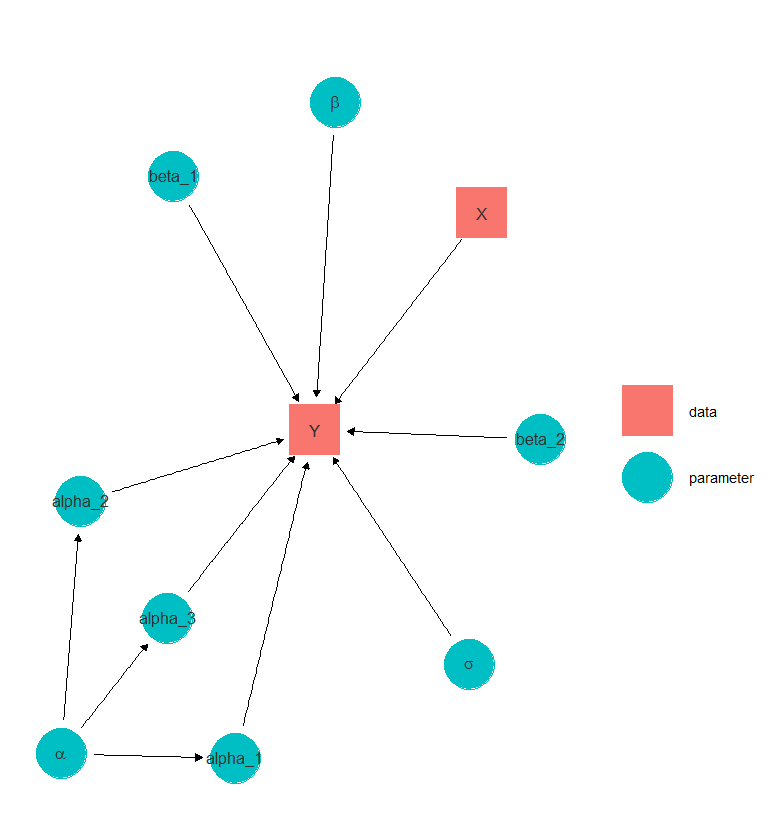 ] .pull-right[ `$$pop \sim Poisson( pop\_density * settled)$$` `$$pop\_density \sim Lognormal( \mu, \sigma)$$` <br> `$$\mu = \alpha_{t,r} + \beta_t X \\[10pt]$$` <br> `$$\alpha_{t,r} \sim Normal(\alpha_t, \nu_t)$$` <br> `$$\alpha_t \sim Normal( \alpha, \nu)$$` ] --- class: inverse, left, middle # What remains to be learned? --- class: center, middle # Do your own model! --- # Practice 1. Defining models -- 2. Defining priors -- 3. Collecting covariates -- 4. Structuring the hierarchy --- class: center, middle # Add additional submodels --- # Modelling #### Hierarchical structure on the variance term <br> .pull-left[] -- .pull-right[ `$$pop \sim Poisson( pop\_density * settled)$$` `$$pop\_density \sim Lognormal( \mu, \sigma_t)$$` ] --- # Modelling #### Missing households: **Measurement error model** on population count <br> .pull-left[  ] -- .pull-right[$$ N \sim Binomial (pop, \theta) $$ `$$pop \sim Poisson( pop\_density * settled)$$` `$$pop\_density \sim Lognormal( \mu, \sigma)$$` <br> WorldPop. 2020. Bottom-up gridded population estimates for Zambia. https://dx.doi.org/10.5258/SOTON/WP00662] -- <br> Other potential measurement error models: covariates, settlement... --- # Modelling #### Complex sampling design: **Weighted likelihood** `$$pop_i \sim Poisson( pop\_density_i * settled_i)$$` `$$pop\_density_i \sim Lognormal( \mu, \tau_i)$$` $$ \tau_i = \frac{w_i}{\sigma}$$ --- # Modelling #### Age and sex structure .pull-left[ <img src="day5_presentation_files/pic/day5_agesex3.png" alt="drawing" width="300"/> <img src="day5_presentation_files/pic/day5_agesex4.png" alt="drawing" width="300"/> ] .pull-right[ `$$pop \sim Poisson( pop\_density * settled)$$` `$$pop\_density \sim Lognormal( \mu, \sigma)$$` <br> $$ pop_g \sim Multinomial( pop, \gamma) $$ $$ \gamma \sim Dirichlet(rep(1,g))$$] --- class: center, middle # Gain programming expertise --- # Programming - Vectorisation -- - Reparametrisation